Business Model
Content may include inaccuracies, outdated information, or technical errors. Users are advised to cross-check critical information before implementation.
The notation describes how an organization is built: its market and customers, goals, capabilities and assets, revenue and costs, plans, hypotheses and indicators.
Create the model and pick a canvas
Create a model Ledgerly of the type Business Model. Rename its first
diagram to Lean Canvas and set Viewpoint to Lean Canvas in the form of
the diagram.
The viewpoint narrows the palette to the element types of that canvas. Clear it, and the whole language is available.
Problem and solution
Create from the palette:
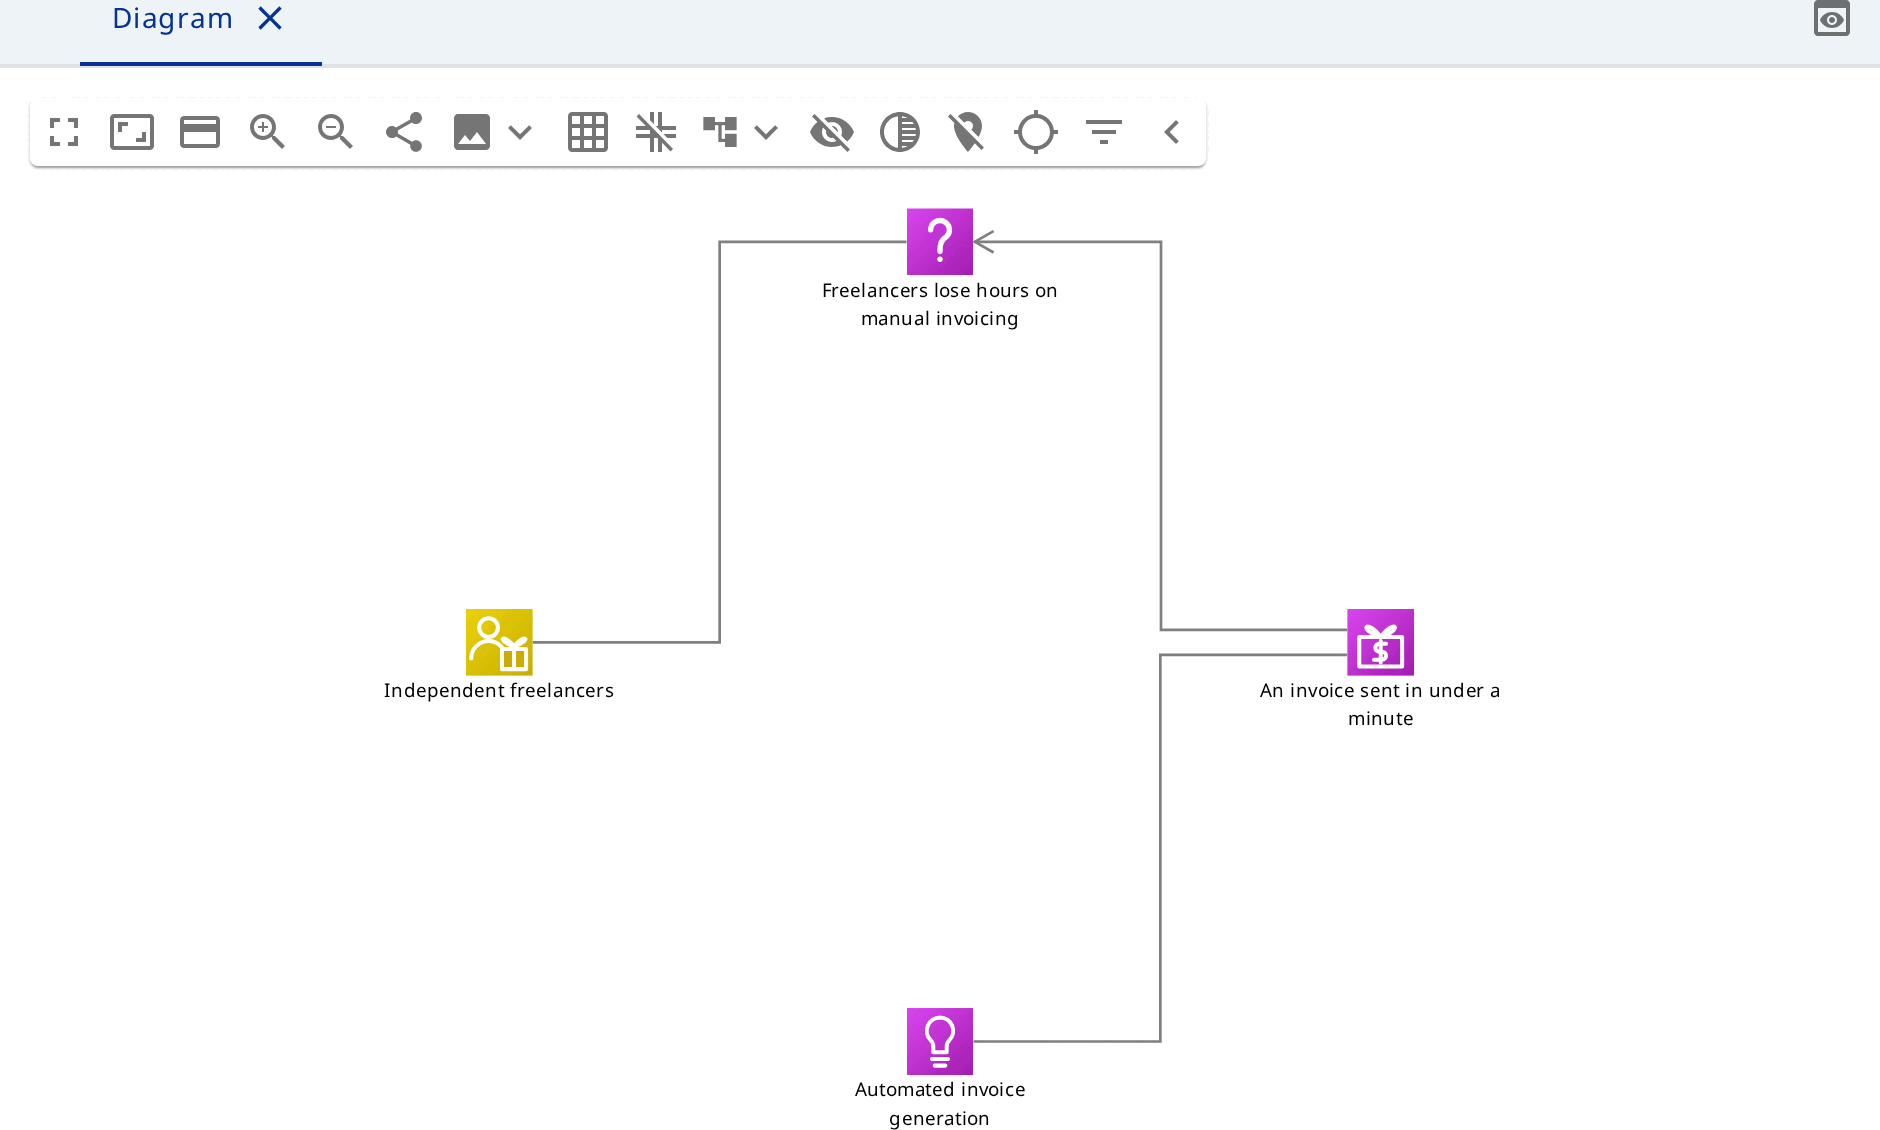
- Problem
Freelancers lose hours on manual invoicing; - Customer
Independent freelancersand an Association namedsuffers fromfrom the customer to the problem; - Value Proposition
An invoice sent in under a minuteand an Influence to the problem; - Solution
Automated invoice generationand an Association to the value proposition.
Resources of the solution
Create Capability Payment reconciliation, Technology
Bank data ingestion and Intellectual Property Reconciliation ruleset.
Nest them inside the solution and draw Composition from the solution to
each.
Add the financial part: Channel Web app, Revenue Stream
Monthly subscription and Cost Component Hosting and payment fees. Draw
Flow from the customer to the revenue stream and Usage from the customer
to the channel.
An indicator
Create a Metric Monthly recurring revenue with Unit EUR. Then create
a Metric Value and set: Metric - the metric just created, Value
40, Scale kilo, Type Actual, Scenario Base, and the date the
value holds for.
This node needs no name: the label Monthly recurring revenue: 40 kilo EUR is
computed from the values.
Hypotheses
Create a second diagram Validation without a viewpoint - every element type is
available on it. Place:
- Hypothesis
Freelancers will pay 12 EUR a month, StatusTesting; - Experiment
Pricing landing page, Result9% sign-up rate; - Evidence
Landing page analyticswith a Link filled in; - Risk
Dependency on a single payment provider; - Assumption
Freelancers invoice at least twice a month.
Draw Association from the hypothesis to the experiment and from the experiment to the evidence, and Dependency from the risk to the hypothesis.
Drag Independent freelancers and Monthly subscription onto this diagram from
the model explorer - the relationship between them comes with them.
A third diagram
Both diagrams work with one set of elements. Add a third diagram with the viewpoint Business Model Canvas and drag the customer, the value proposition, the channel, the revenue stream and the cost component onto it.