Impact analysis
Content may include inaccuracies, outdated information, or technical errors. Users are advised to cross-check critical information before implementation.
Before a system is changed or retired, everything the change affects has to be listed: the processes that depend on it, the applications next to it, the reports built on its data. When the architecture is described by a model, that information is already in the model.
The answer is assembled in the Graph application at apps.architeezy.com. The application opens a model from the repository, shows it as a graph, filters out what is not needed and exports the result. It does not change the model.
The model
The application starts with a list of models - pick the one that describes the system. Public models open immediately; to reach the rest, click Sign in and sign in to Architeezy in the window that opens.
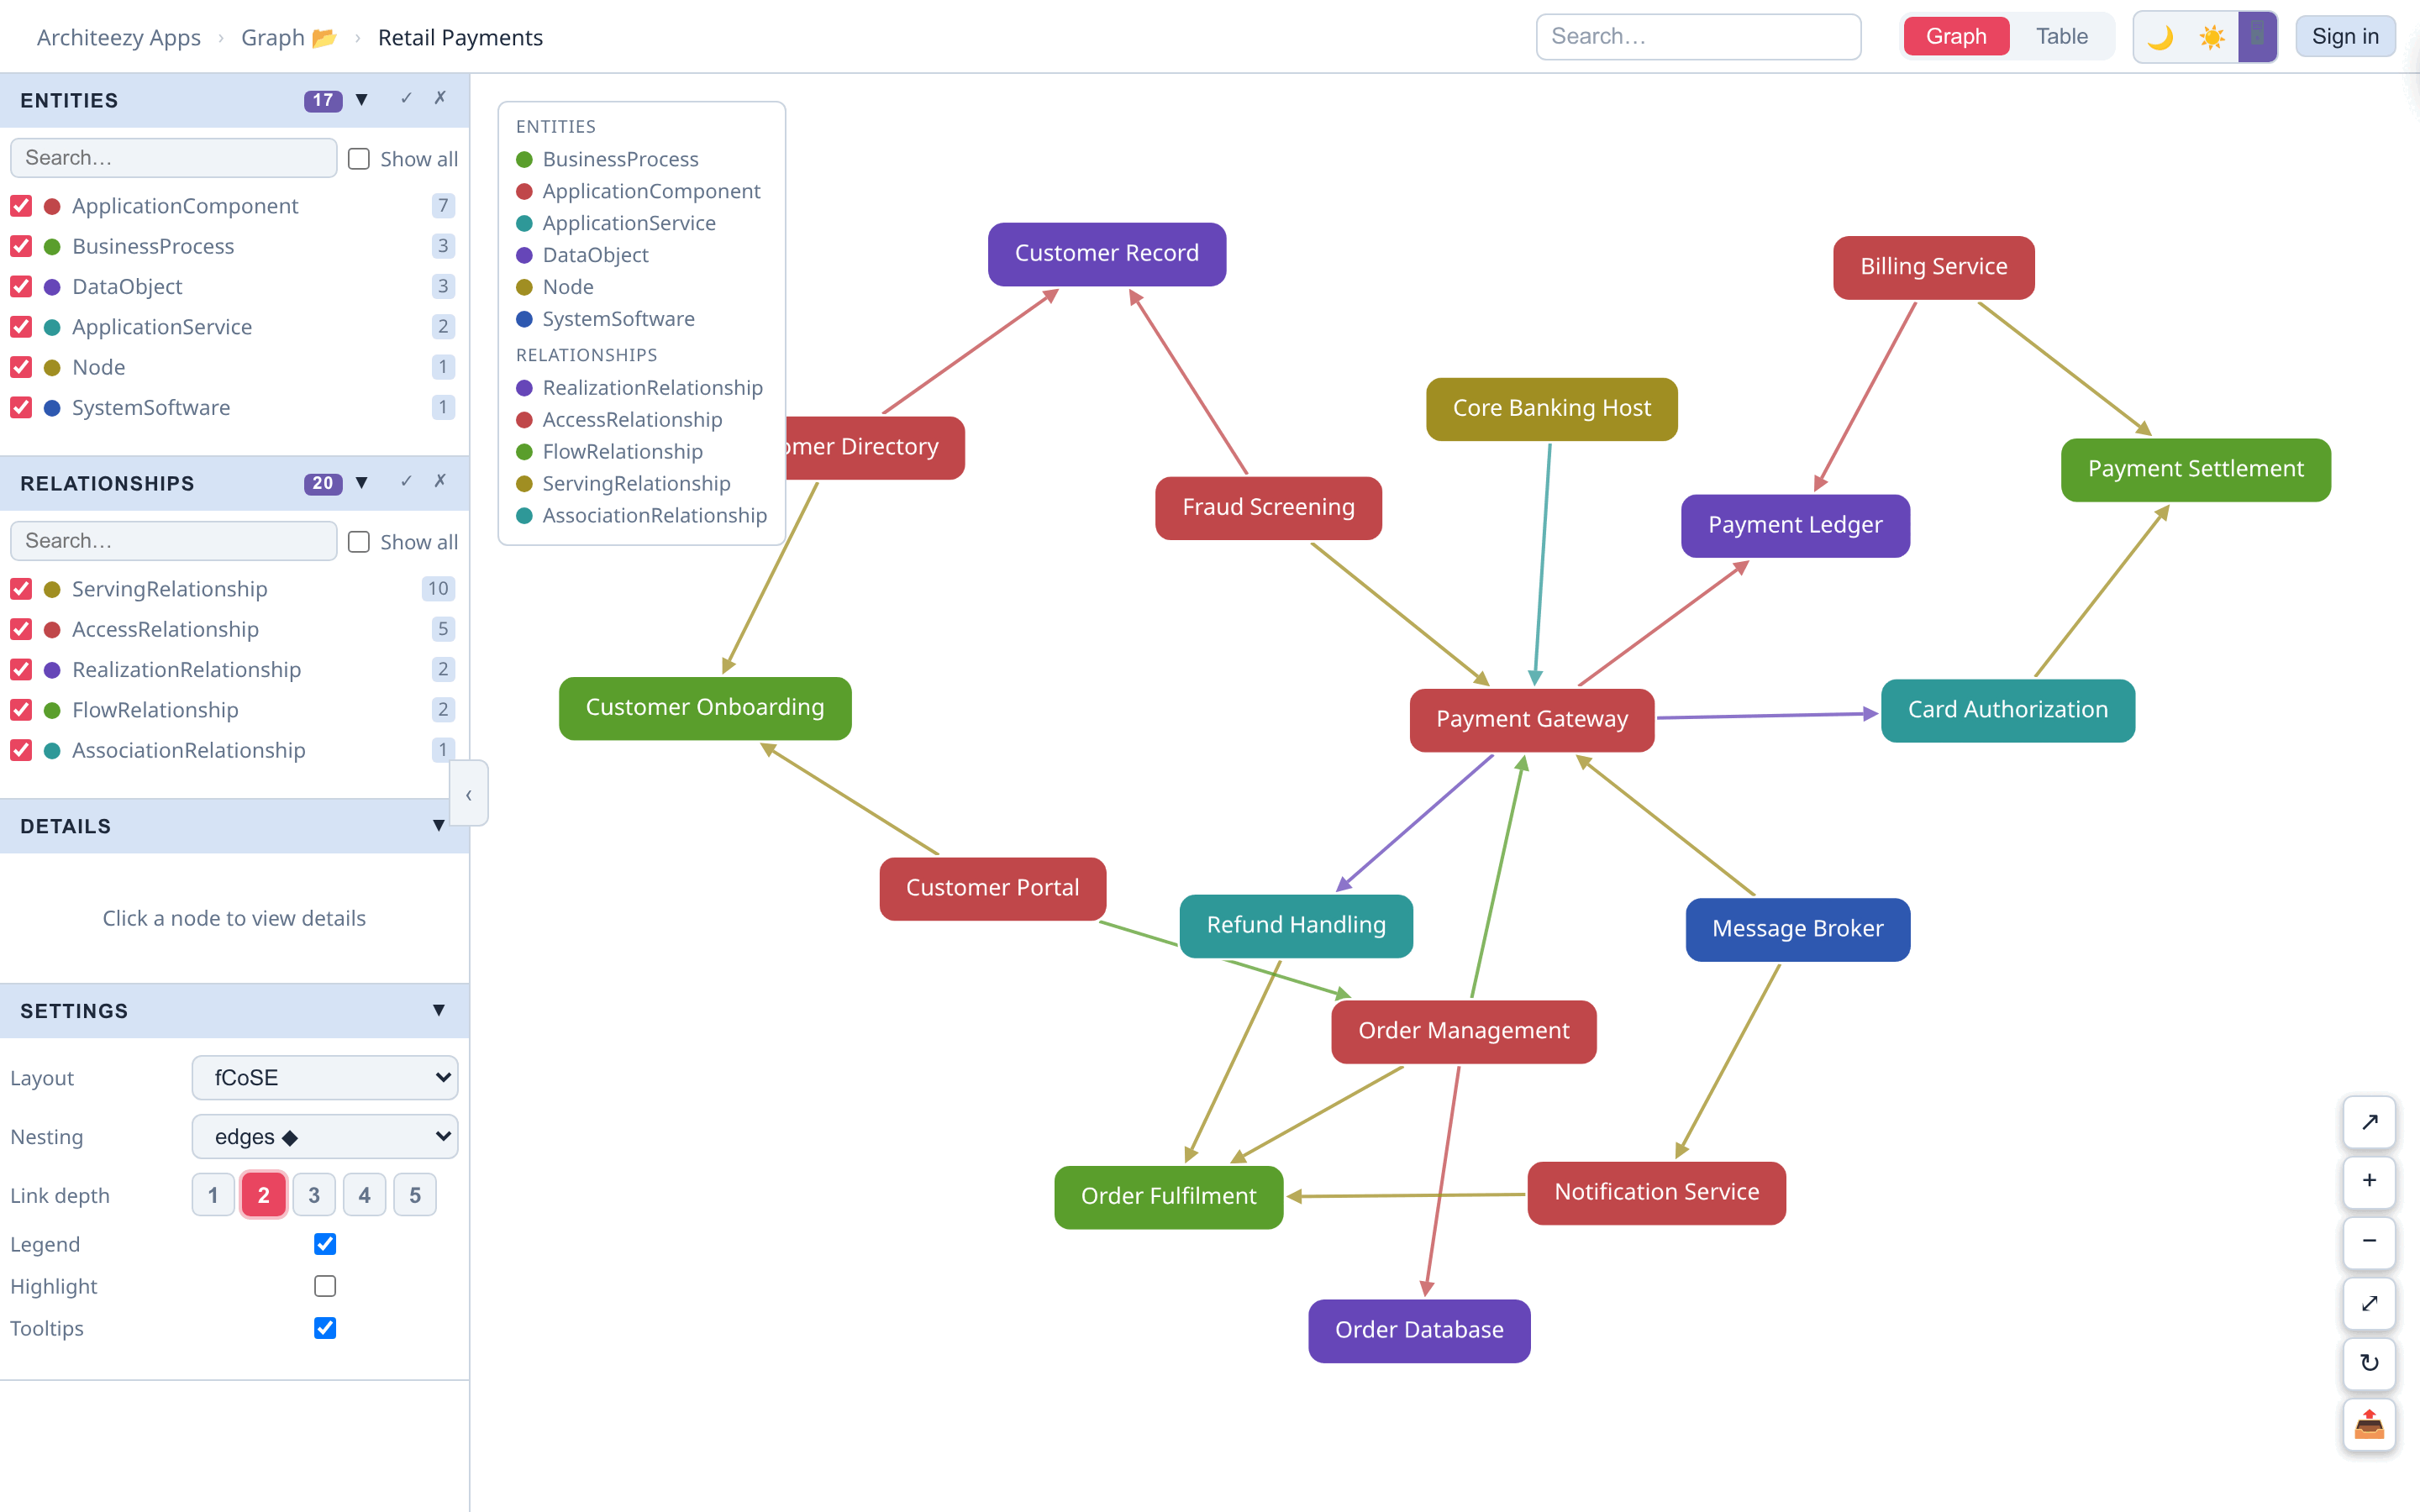
The canvas shows the whole model: entities as nodes, relationships as arrows from source to target. The colour of a node stands for the type of the entity; the key to the colours is turned on by the Legend checkbox under Settings.
Finding the system
Enter the name in the search field at the top: the matches stay bright, the rest of the model is dimmed. If you do not remember the exact name, open the Table tab and sort the entities by type. A click on the row found there returns to the graph and brings the node to the centre of the window.
Click the node: Details shows what the element is and what it is connected to, one row per connection, with a direction and a type. The nearest neighbours are visible from here; beyond them the graph is easier to read.
Elements the change reaches
Double-click the node. Only it and the elements connected to it directly stay on the canvas - what the change affects first.
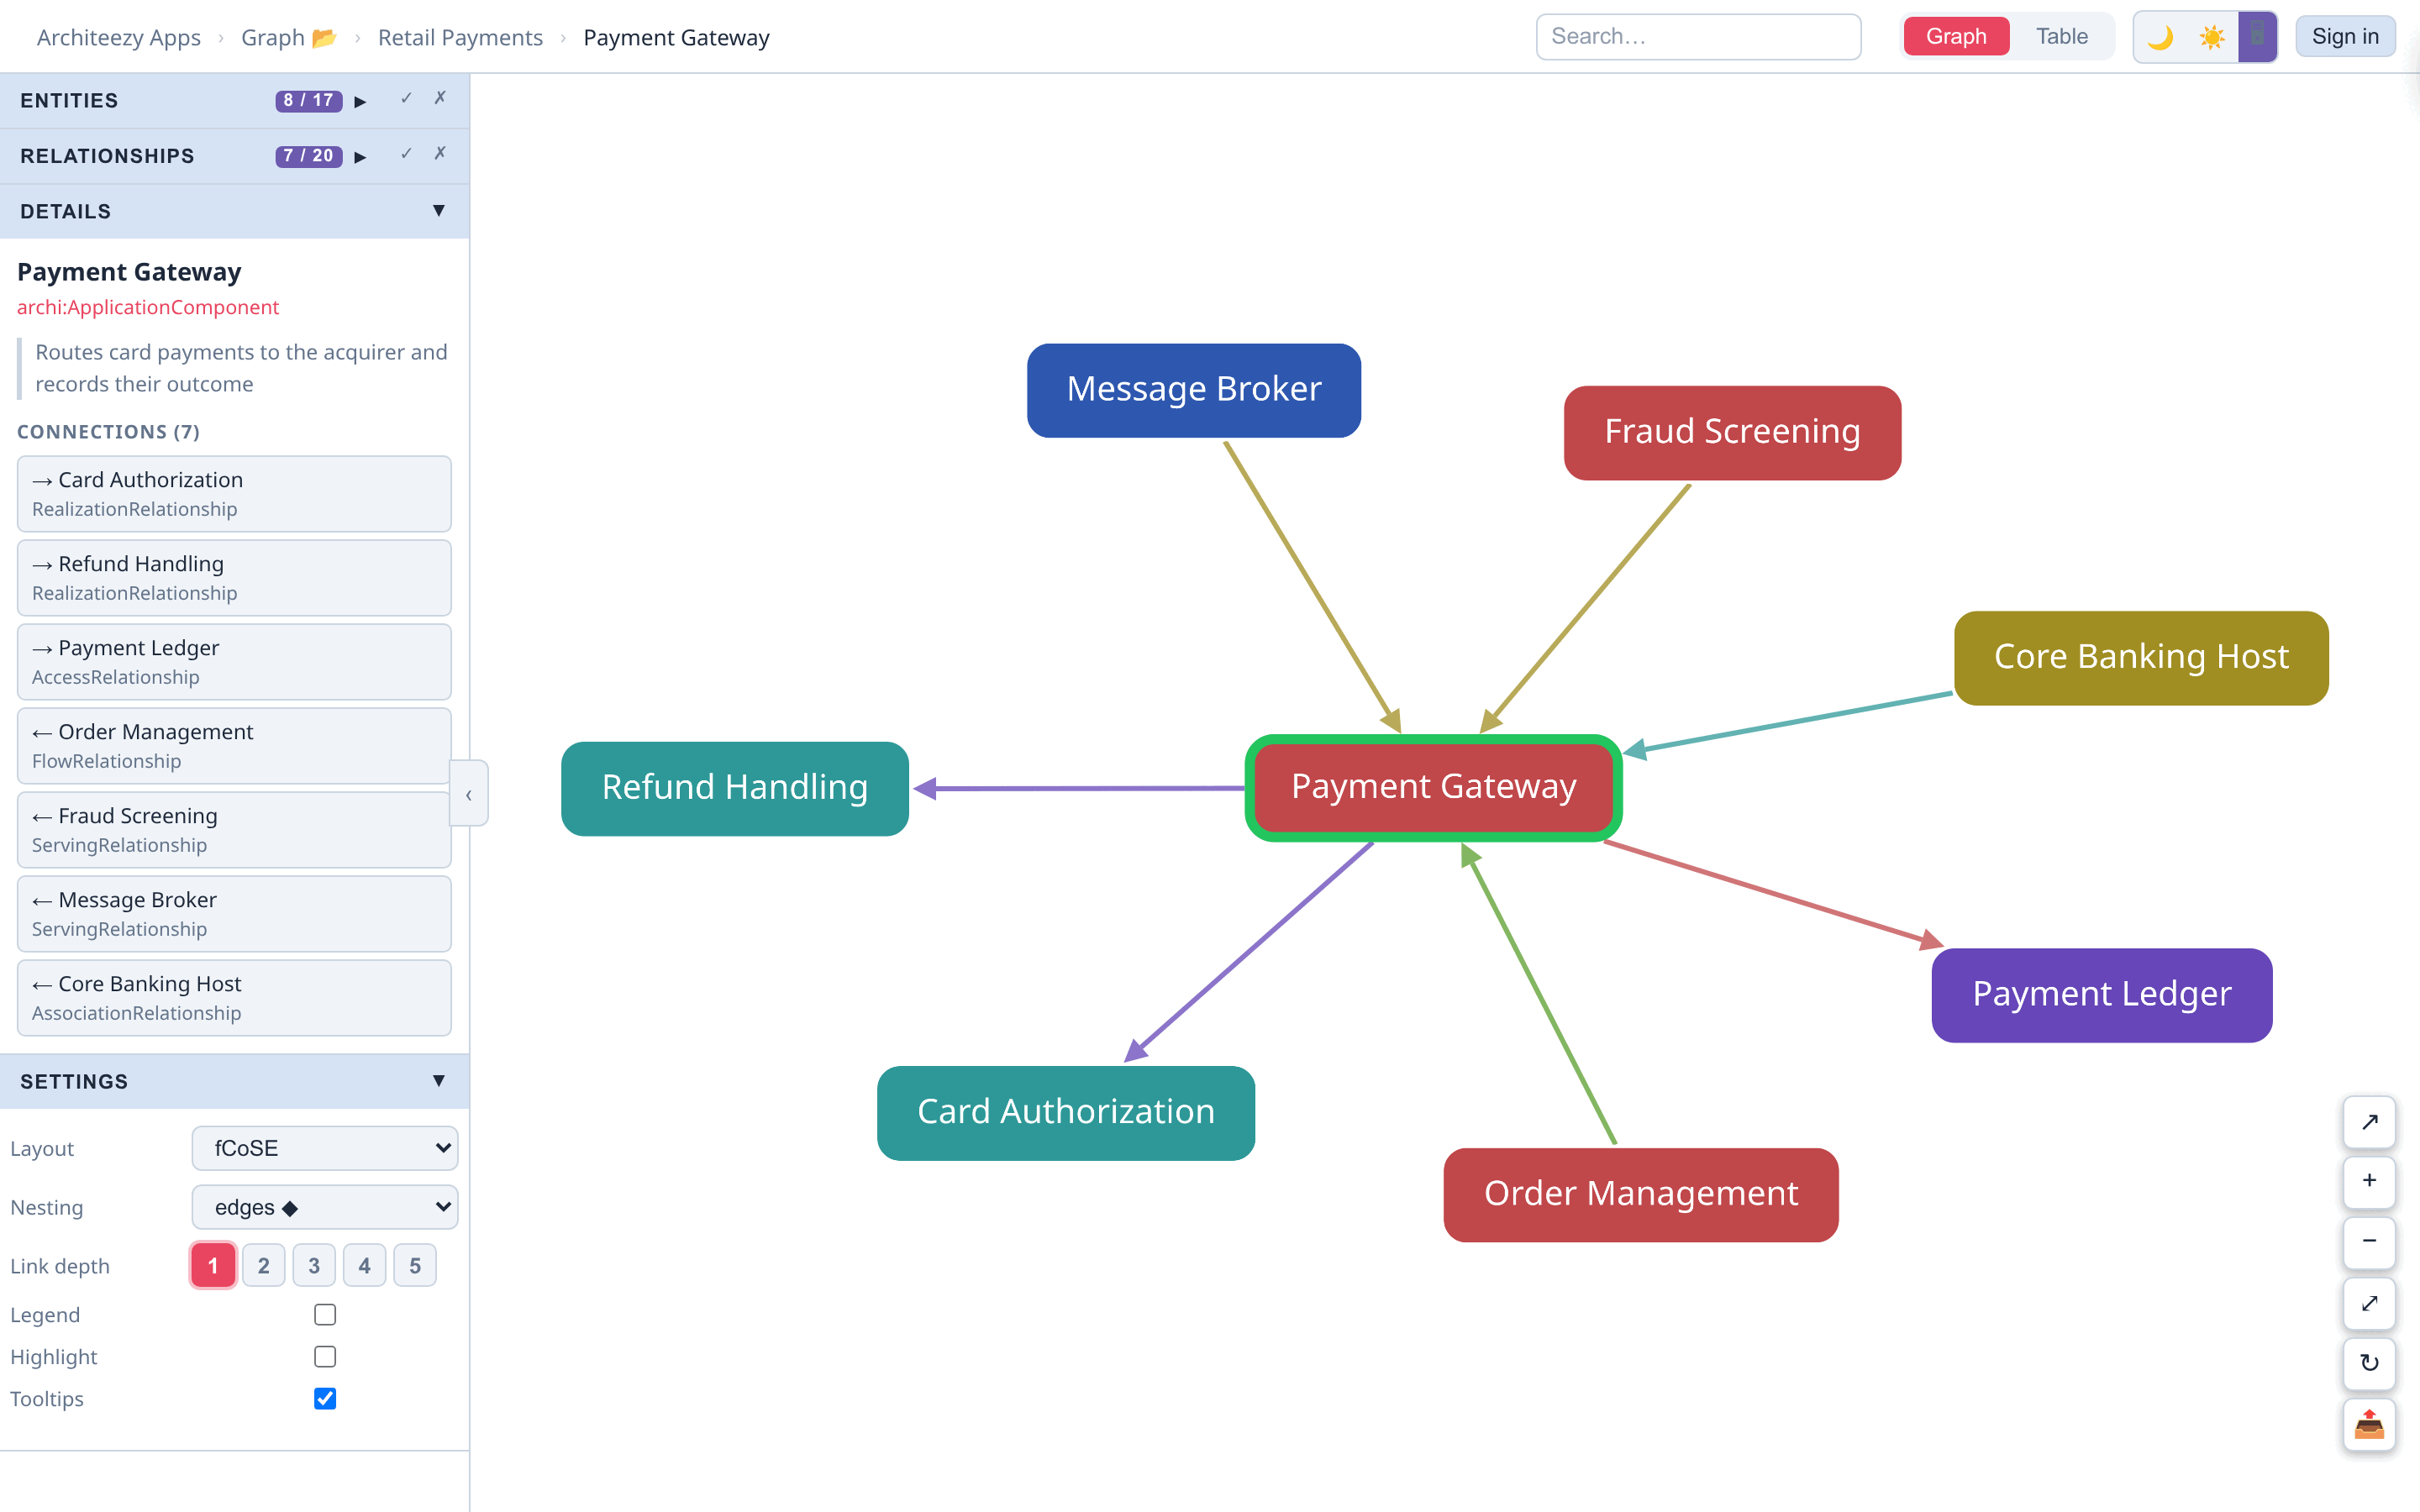
A change rarely stops at the first ring: a process depends on an application, the application on a message queue. Link depth under Settings adds the next rings, up to five.
If there is less on the canvas than expected, two rules are the reason:
- an element is shown only if a path runs to it from the selected element along visible relationships, so hiding a relationship type also hides everything that was held by it alone;
- a relationship between two elements at the same distance appears one ring later than the elements themselves.
Double-clicking a neighbour moves the analysis to it, and a click on the model name in the top line brings back the whole model.
Filtering out what is not a dependency
Not every relationship means that a change reaches the neighbour: an association with the owner of a system or a link to a document breaks nothing. Entities and Relationships list the types that occur in the model and the number of objects of each type. Clear a type and the objects of that type disappear from the graph and from the table, together with everything that was held by them alone.
The list
The Table tab shows what is left: entities on one tab, relationships on the other. This is the answer - the list of what has to be checked, agreed or reworked. Export saves the table as CSV to attach to a ticket, and the graph as PNG or SVG to put in an email or a document.
A link to the page opens the same view, so the result can be passed on as a link.
The findings in the whole landscape
To see where the affected elements sit in the landscape, turn on the Highlight checkbox under Settings and select a node. The selected element and its neighbours stay bright and the rest of the model is dimmed, but stays on the canvas in place. Link depth applies here as well.